Who is #1?: Measuring Manufacturing Value Added per Employee Across the Nation
"I’ve been on a long-term quest to convince folks that productivity is important and not just something economists are concerned about. I’ve written about productivity a couple of times over the years, so when an MEP center director recently asked me to assemble some information on productivity (or a proxy) across the states, I was up for the challenge.
I started out with the goal of just assembling the data, but I was fascinated by what it told me about different regions of the country. My research showed which states have more productive manufacturing sectors and how they stack up in comparison to one another in terms of productivity per employee. These insights could help MEP Centers develop ideas for helping their clients and states increase productivity.
I was able to find what I needed at the U.S. Bureau of Economic Analysis, in the data it publishes on GDP by industry, as well as wage and salary employment for each state. GDP by industry is a good proxy for productivity since it’s defined as gross output minus the cost of goods sold. For comparison purposes, we can call this proxy “manufacturing value added per employee” or “value added.” (If anyone wants the actual data, I would be happy to share the spreadsheet, please contact me).
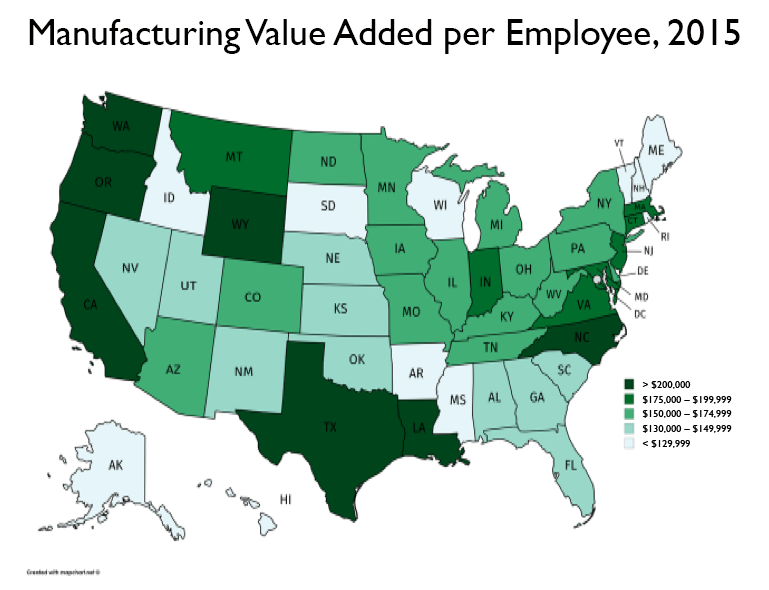
I was struck by the variability across the 50 states. Indeed, the variation was much higher than I would have expected. Manufacturing value added overall for the nation was $175,959 in 2015. Manufacturing value added per employee in 2015 (the most recent year in which both GDP by industry and employment are available) ranged from a low of just over $92,000 in Vermont to a high of nearly $355,000 in Louisiana. Value added per employee in Louisiana is nearly four times higher than it is in Vermont. I divided the states into five groups based on manufacturing value added per employee in 2015 and plotted them on the map below.
The darker the green shading, the higher the state’s manufacturing value added. From the map, you can see clusters of similarity between neighboring states. The states with the highest value added are along the East, West, and to some extent the Gulf coasts. There is also a cluster of states in the Southeast and New England that have the lowest value added. There are a handful of other states that stick out; for instance, Wyoming has a very high manufacturing value added per employee rate and Wisconsin has a much lower rating than most of its peer states in the Midwest."